Is Bitcoin on the verge of a new bullrun?
After a few cold winters with wild fluctuations on the upper end lower end of the spectrum, Bitcoin’s price is finally stabilizing.
The cryptocurrency has been hovering between $8000-$10000 for more than a year already, with the exception of the unfortunate “crash” caused by the news of COVID-19.
When looking at historical events, Bitcoin seems to have a high probability to enter a new bull-run. Some may argue that we are already into one ever since the latest lows of 2018, but it would be more appropriate to say that we are still recovering. The majority of investors are still at loss.
In this article, we will take a look at some interesting data points that indicate Bitcoin’s future trajectory. So keep on reading to get a better idea of where we are headed.
Post halving sentiment
It was just one month ago that Bitcoin experienced its third halving. Essentially, all miners will now be receiving just half of the rewards they were receiving for the past few years. And that is big news!
For any other asset, this type of news would bring a huge inflow of investors. Imagine if half of the oil tanks worldwide would dry up – the value of oil would skyrocket.
The same is not necessarily true with Bitcoin. With cryptocurrency, all that matters is the demand. And we are currently still at a phase where people are hesitant to invest.
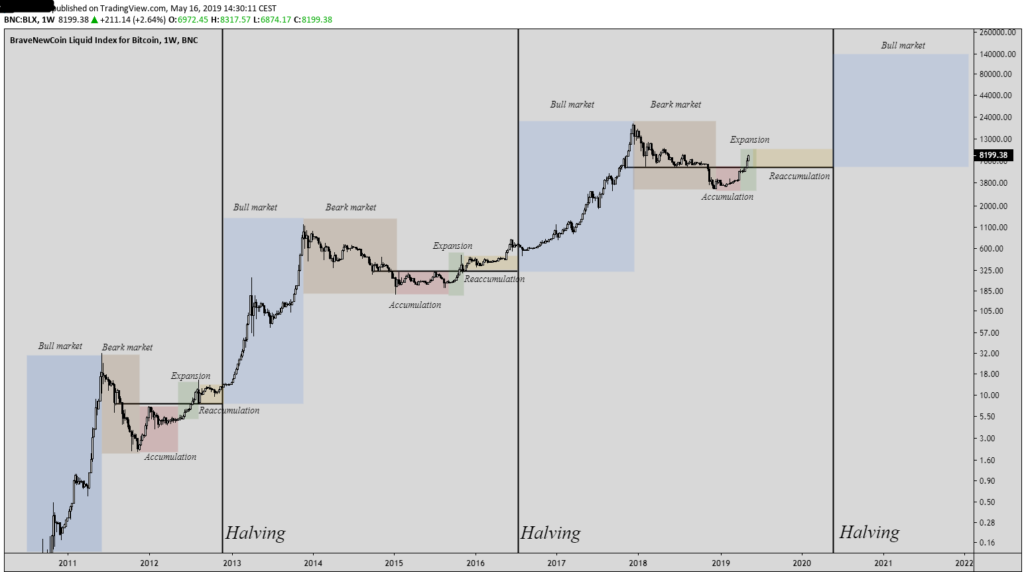
But let’s have a look at historical patterns. How did Bitcoin react after its previous halvings?

What we can notice from the image above is that there are certain timeframes where demand builds up. In the case of Bitcoin, it takes on average 1 year from the time of the halving to see a new all-time high. We are currently one month post-halving so we should hopefully see some price swings happening soon.
Historically, after the price surge occurs, Bitcoin tends to enter in a bear market phase. In the last phase, the lowest we saw Bitcoin drop during its bear market was $3200, which occurred in the first days of January 2019. Knowing this will also help you prepare a plan of action right after the bull market has concluded.
The S2FX model
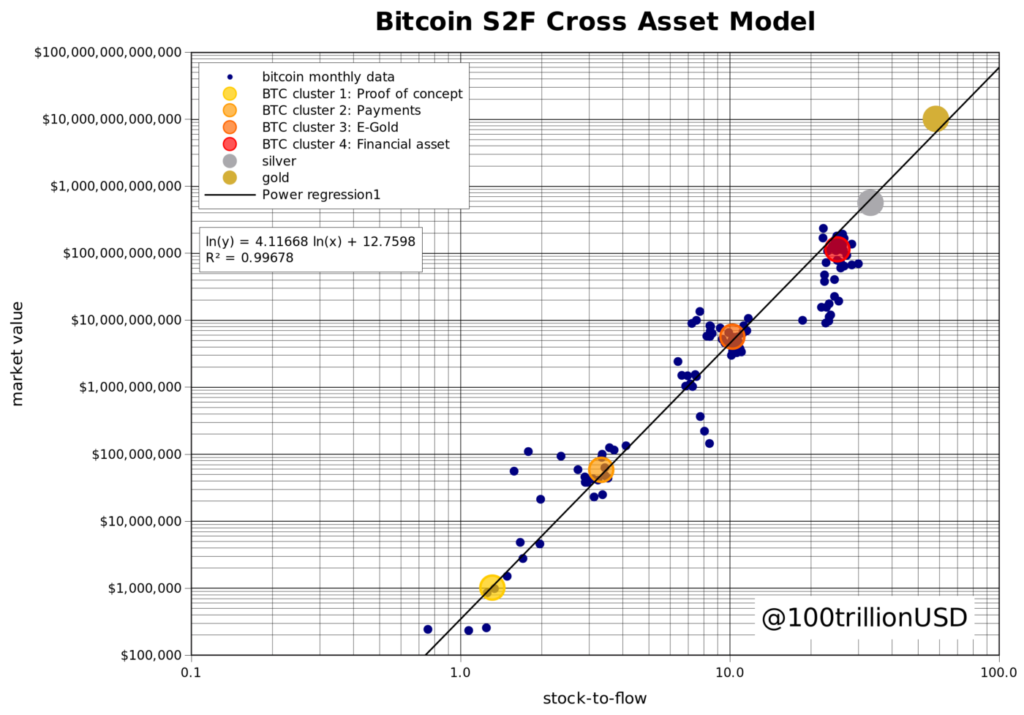
One of the most interesting price prediction models of the past year belongs to Twitter user @1trillionUSD. The Dutch financial analyst who prefers to keep his identity hidden created a Stock-to-Flow model specifically for Bitcoin, to measure its scarcity.
The model compares Bitcoin’s reserves with the annual production to get a better understanding of where the price is headed to.
According to the model, we could see Bitcoin peak anywhere between $55.000 and $288.000. However, the author takes an objective viewpoint and does inform the readers that he is prepared to be proven wrong as well.

To read more and understand how this model works have a look at his article. Then, make sure to also read the updated version of the model (S2FX) where he removes the timeframes and simply compares the price with other assets (gold and silver).
Coin Value / Moving Ratio
A less known data metric provided by analytics company Glassnode suggests that Bitcoin is on the edge of starting a new bull run.
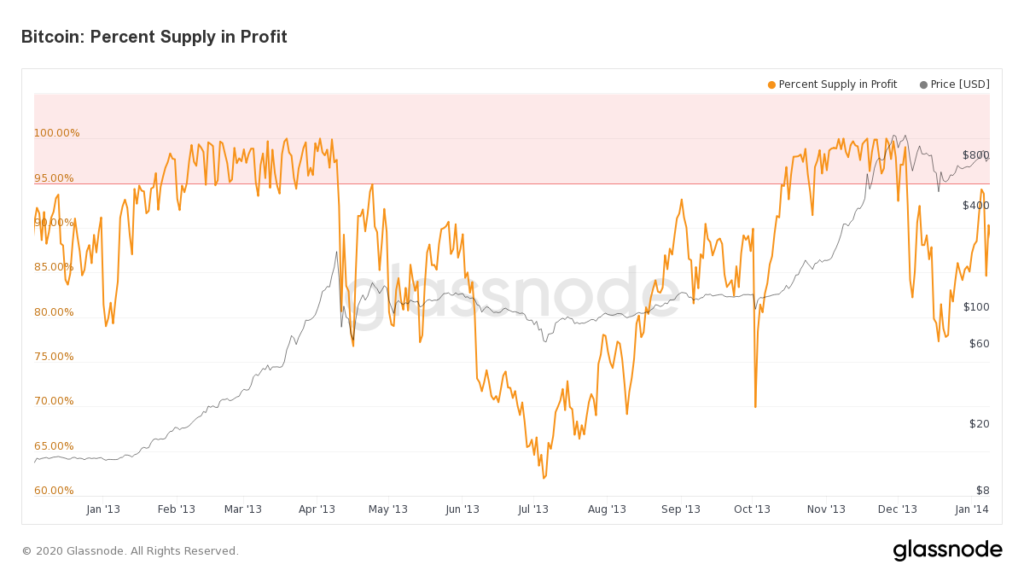
The data metric calculates the % of Bitcoin that has a higher value right now compared to when it was last moved.
In short, more than 16 million Bitcoin of the current circulating supply is seeing price increases. That is 87% of the 18,4 million BTC that have been mined.
You might argue that many of those coins simply come from lost or inaccessible wallets and that would be a valid concern. However, keep in mind that lost coins were also taken into consideration during previous data collections.
This 87% is very similar to the levels that pre-exceeded the previous bull runs. Glassnode mentioned that when more than 90% of the coins are appreciating in value we have a clear signal of a bull market.
For example, we saw the ratio surpass 90% back in October of 2016. It was during that time when Bitcoin went from its $470 lows in August to $1,100 in the first months of the following year.

The price rally continued as Bitcoin eventually reached its peak close to $20.000 in December of the same year. Throughout all this time, the data indicates that 80-99% of coins appreciated in value since it was last moved.

We can see similar patterns also when looking further back in time. In January 2013, the supply in profit crossed 90% and stayed there for almost 100 days. During this time, Bitcoin reached a price of $250 (by mid-April). The same pattern was observed later that year when Bitcoin reached $1000.
So, once again, if history is any indication of the future, we could see a massive bullrun as soon as the percentage of supply in green increases to 90%+ levels.
More transparent markets
Apart from data and predictions, it is important to also look at the space as a whole. Since the latest bull-run, ICO’s have almost completely perished, and buying Bitcoin has become a lot easier than before. Investing in cryptocurrency is no longer reserved for the tech-obsessed.
In there was another discovery that surprised everyone in the crypto community. According to Bitwise’s report for the SEC, more than 95% of exchanges were reporting fake volumes.

In their effort to maximize their profits, they delivered a major hit to the transparency of the crypto markets as a whole.
Thankfully, since the recent acquisition of CMC by Binance, the data provider is now more transparent than ever before.
All this leads to a more regulated and mature market that is able to handle the increase in demand. All we can do right now is wait and be patient. History may prove to us, once again, that Bitcoin has a lot left in its tank.


